 I have installed Windows 10 on Raspberry Pi 2, then I have created a simple C# application for it. Now, I am curious what is the difference in performance between Windows 10 IoT Core and Raspbian. To test that I will run a simple C# code on both OS.
Code
I will do a simple calculation in a loop and will run this code in multiple threads. The amount of threads - 4, because Raspberry Pi 2 has 4 cores. This will load CPU up to 100%.
I know that I am using different CLRs and different compilators, but I am doing this just for fun :)
Because you cannot run C# application on Windows 10 in console mode I will use a bit different code for each OS.
Raspbian
Mono JIT compiler version 4.0.1
public class Program
{
    private static int iterations;
    private static void Main(string[] args)
    {
        iterations = 100000000;
        var cpu = Environment.ProcessorCount;
        Console.WriteLine("Iterations: " + iterations);
        Console.WriteLine("Threads: " + cpu);
        Profile(cpu);
    }

    private static void Profile(int threads)
    {
        // Warm up JIT
        DoStuf();
        Iterate();

        var watch = new Stopwatch();
        Task[] tasks = new Task[threads];

        for (int i = 0; i < threads; i++)
        {
            tasks[i] = new Task(Iterate);
        }

        // clean up
        GC.Collect();
        GC.WaitForPendingFinalizers();
        GC.Collect();

        watch.Start();

        for (int i = 0; i < threads; i++)
        {
            tasks[i].Start();
        }

        Task.WaitAll(tasks);

        watch.Stop();
        Console.WriteLine("Time Elapsed {0} ms", watch.Elapsed.TotalMilliseconds);
    }

    private static void Iterate()
    {
        for (int i = 0; i < iterations; i++)
        {
            var c = DoStuf();
            a = c/2*a;
        }
    }

    public static int a;

    private static int DoStuf()
    {
        var y = 2 + a;
        return y*a/9;
    }
}
Compile:
mcs /debug- /optimize+ /platform:arm bench.csWindows 10
Microsoft .net 4.5
public sealed partial class MainPage : Page
{
    public MainPage()
    {
        this.InitializeComponent();
    }

    private static int iterations = 100000000;

    private void ButtonBase_OnClick(object sender, RoutedEventArgs e)
    {
        ResultLabel.Text = "Calculation:";
        var cpu = Environment.ProcessorCount;
        ResultLabel.Text += "\nIterations: " + iterations;
        ResultLabel.Text += "\nThreads: " + cpu;
        ResultLabel.Text += "\n" + Profile(cpu);
    }

    private static string Profile(int threads)
    {
        // warm up
        DoStuf();
        Iterate();

        var watch = new Stopwatch();
        Task[] tasks = new Task[threads];

        for (int i = 0; i < threads; i++)
        {
            tasks[i] = new Task(Iterate);
        }

        // clean up
        GC.Collect();
        GC.WaitForPendingFinalizers();
        GC.Collect();

        watch.Start();

        for (int i = 0; i < threads; i++)
        {
            tasks[i].Start();
        }

        Task.WaitAll(tasks);

        watch.Stop();
        return $"Time Elapsed {watch.Elapsed.TotalMilliseconds} ms";
    }

    private static void Iterate()
    {
        for (int i = 0; i < iterations; i++)
        {
            var c = DoStuf();
            a = c/2*a;
        }
    }

    public static int a;

    private static int DoStuf()
    {
        var y = 2 + a;
        return y*a/9;
    }
}
and UI:
<Grid Background="{ThemeResource ApplicationPageBackgroundThemeBrush}">
    <StackPanel Orientation="Vertical">
        <Button x:Name="StartButton" Content="Start" FontSize="100" Click="ButtonBase_OnClick"/>
        <TextBlock x:Name="ResultLabel"
                FontSize="150"/>
    </StackPanel>
</Grid>
I have used Visual Studio 2015 to compile and deploy this app in Release mode.
As you can see I have used static variable in calculations (DoStuf and Iterate methods). This will prevent compiler from optimization.
Results
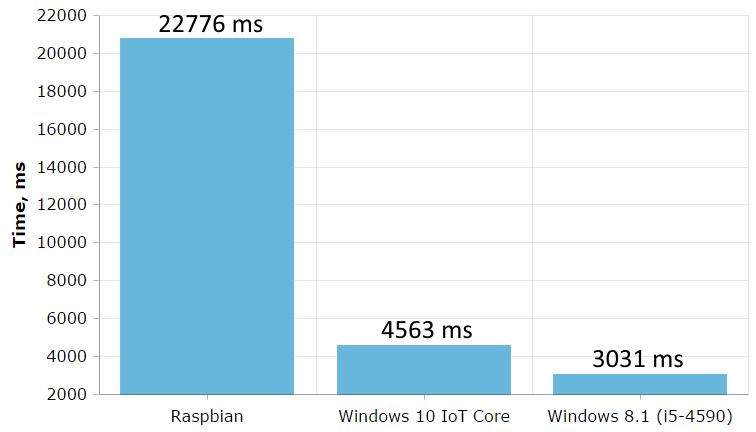
I have executed each program 10 times and then calculated an average execution time. I have also tested console application on my desktop (Intel Core i5-4590). I was surprised (less is better)...
As you can see mono runtime on Raspbian is 5 times slower than Microsoft .Net on Windows 10 IoT Core. Mono is 5 times slower! Why? Maybe I have made incorrect benchmark? Or is it just a question of compiler optimization?
I have checked IL code. Iterate and DoStuf methods compiled to the same code:
  .method private hidebysig static void  Iterate() cil managed
  {
    // Code size       43 (0x2b)
    .maxstack  2
    .locals init (int32 V_0,
             int32 V_1)
    IL_0000:  ldc.i4.0
    IL_0001:  stloc.0
    IL_0002:  br         IL_001f

    IL_0007:  call       int32 CpuBenchmark.Program::DoStuf()
    IL_000c:  stloc.1
    IL_000d:  ldloc.1
    IL_000e:  ldc.i4.2
    IL_000f:  div
    IL_0010:  ldsfld     int32 CpuBenchmark.Program::a
    IL_0015:  mul
    IL_0016:  stsfld     int32 CpuBenchmark.Program::a
    IL_001b:  ldloc.0
    IL_001c:  ldc.i4.1
    IL_001d:  add
    IL_001e:  stloc.0
    IL_001f:  ldloc.0
    IL_0020:  ldsfld     int32 CpuBenchmark.Program::iterations
    IL_0025:  blt        IL_0007

    IL_002a:  ret
  } // end of method Program::Iterate

  .method private hidebysig static int32
          DoStuf() cil managed
  {
    // Code size       19 (0x13)
    .maxstack  2
    .locals init (int32 V_0)
    IL_0000:  ldc.i4.2
    IL_0001:  ldsfld     int32 CpuBenchmark.Program::a
    IL_0006:  add
    IL_0007:  stloc.0
    IL_0008:  ldloc.0
    IL_0009:  ldsfld     int32 CpuBenchmark.Program::a
    IL_000e:  mul
    IL_000f:  ldc.i4.s   9
    IL_0011:  div
    IL_0012:  ret
  } // end of method Program::DoStuf
Calling code also looks similar in both cases. I have also tried similar code but with single thread, results were the same.
Now I will wait for Core CLR for Linux and do this benchmark again. I hope we will have better results.
